How to Calculate NPV in Excel Manually & Why You Need This Skill
Introduction: Setting the Stage for NPV in Excel
In today’s fast-paced financial world, understanding the intricacies of key metrics is paramount. One such metric, the Net Present Value (NPV), is a cornerstone in financial analysis. But while many professionals rely on Excel‘s built-in functions, there’s a growing demand to grasp how to calculate NPV manually in Excel. Why? Because diving into the manual process can offer insights that automated functions might gloss over.
While many know what NPV is, how to apply it in Excel is a different matter, so I want to show you both the automated and manual pathways to calculate NPV in Excel. By the end, you’ll be equipped with the skills to use Excel’s NPV function and the knowledge to compute it manually, ensuring a holistic understanding of this vital financial tool.
Understanding the Basics of NPV
Laying the Groundwork for Manual Calculations
Before diving into how to calculate NPV manually in Excel, it’s essential to grasp the foundational concepts of NPV. After all, understanding the ‘why’ behind the calculations can significantly enhance the ‘how’.
What is NPV?
At its core, NPV represents the difference between the present value of cash inflows and outflows over a period. In simpler terms, it’s the net value today of future money, considering the time value of that money. Financial professionals often use NPV to evaluate the profitability of investments or projects.
The Magic of Discounting
Transitioning from the abstract to the tangible, let’s discuss the concept of discounting. Imagine receiving $100 today versus a year from now. Intuitively, you’d prefer the money now because of potential opportunities to invest or use it. This preference encapsulates the time value of money.
We discount future cash flows back to their present value to account for this. The rate at which we discount these cash flows is aptly named the ‘discount rate’. It reflects the potential return you could earn elsewhere with that money.
The Formula Behind the Magic
The general formula for NPV is:
NPV = CFt /(1+r)t
Where:
- CFt is the cash flow at time t
- r is the discount rate
- t is the number of time periods
This formula helps us bring future cash flows to today’s terms, allowing for a more apples-to-apples comparison of investment opportunities.
Grasping the basics of NPV is crucial, especially when venturing into manual calculations in Excel. With this foundational knowledge, we’re poised to delve deeper into the practical aspects of NPV, both automated and manual, in the following sections.
Using Excel’s Built-in NPV Function
Excel, the quintessential tool for financial professionals, offers various functions tailored for financial analysis. Among these, the NPV function is a beacon for those wanting to evaluate an investment’s worth quickly. While our guide does delve into how to calculate NPV manually in Excel, it’s equally vital to master the automated route for efficiency’s sake.
A Brief Overview of Excel’s NPV Function
Excel’s NPV function is designed to do the heavy lifting for you. By inputting the discount rate and a series of future cash flows, Excel returns the net present value of those cash flows. It’s a straightforward and efficient method, especially when dealing with multiple cash flows.
Step-by-Step Guide: How to Calculate NPV Using Excel’s Function
- Organizing Your Data:
- Cash Flows: List all expected future cash flows in a column.
- Discount Rate: This is the rate at which future cash flows will be discounted back to the present value.
- Using the NPV Function:
- In a cell, type =NPV(.
- First, input the discount rate.
- Then, select the range of cash flows.
- Press Enter.
- Interpreting the Results:
- The value returned is the net present value of the cash flows based on the discount rate provided.
- A positive NPV indicates a potentially profitable investment, while a negative NPV suggests the opposite.
Example: Calculate NPV in Excel
Let’s consider a hypothetical investment with the following cash flows over five years and a discount rate of 10%:NPV Using Excel Function
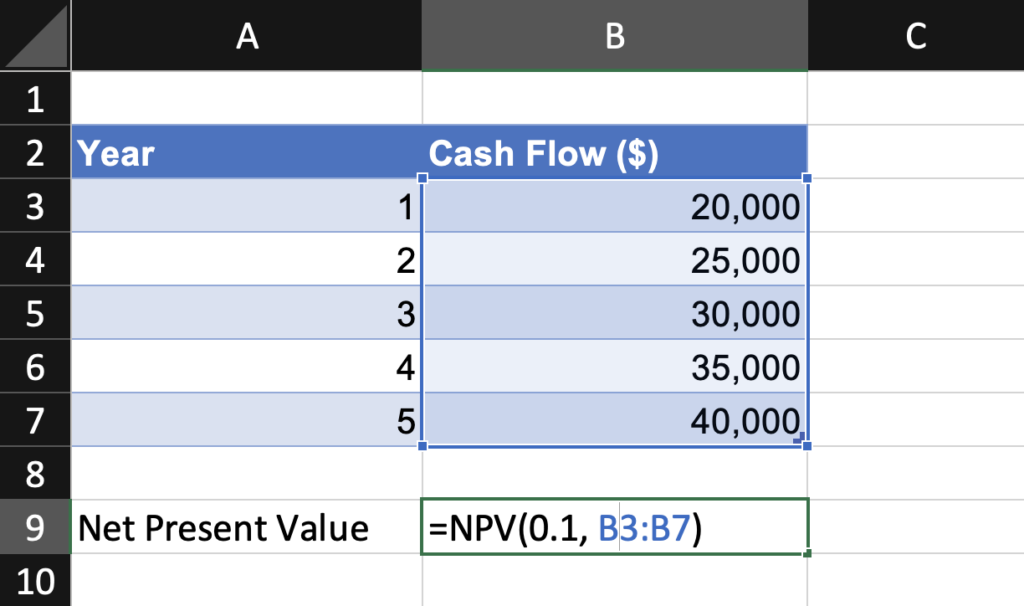
To Calculate the NPV:
- Input the above table into Excel.
- In a cell below the cash flows, type
=NPV(0.10, B3:B7), where B3:B7 is the range of cash flows. - Press Enter. Excel will return the NPV of the investment based on a 10% discount rate.
By following these steps, you’ve successfully used Excel’s built-in function to determine the NPV of an investment. While this method is efficient, understanding how to calculate NPV manually in Excel can offer a deeper grasp of the underlying mechanics, which we’ll explore in the subsequent sections.
Calculating NPV Manually in Excel
While Excel’s built-in NPV function offers a quick and efficient way to determine the net present value of an investment, there’s undeniable value in understanding the mechanics behind the calculation. By learning how to calculate NPV manually in Excel, you gain a deeper appreciation for the nuances of financial analysis and a more intimate grasp of your data.
The Essence of Manual NPV Calculation
Before we delve into the steps, let’s understand why one might opt for manual calculation. Manual NPV calculation in Excel:
- Provides a step-by-step breakdown, enhancing comprehension.
- Offers flexibility, especially when dealing with varying discount rates for different years.
- Allows for custom adjustments and tweaks based on specific scenarios.
Steps to Calculate NPV Manually in Excel
- Setting Up Your Excel Sheet:
- Columns to include: Year, Cash Flow, Discount Factor, and Discounted Cash Flow.
- Calculating the Discount Factor:
- For each year, the discount factor is calculated using the formula: =1/(1+rate)^year.
- Computing the Discounted Cash Flow:
- This is the product of the cash flow and its corresponding discount factor.
- Summing Up for NPV:
- The NPV is the sum of all the discounted cash flows.
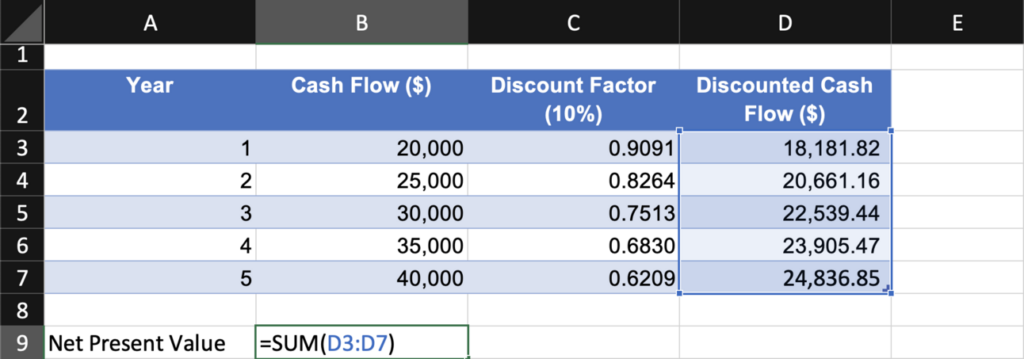
Example: Manual NPV Calculation in Excel
Consider the same hypothetical investment from our previous section:
To calculate NPV manually:
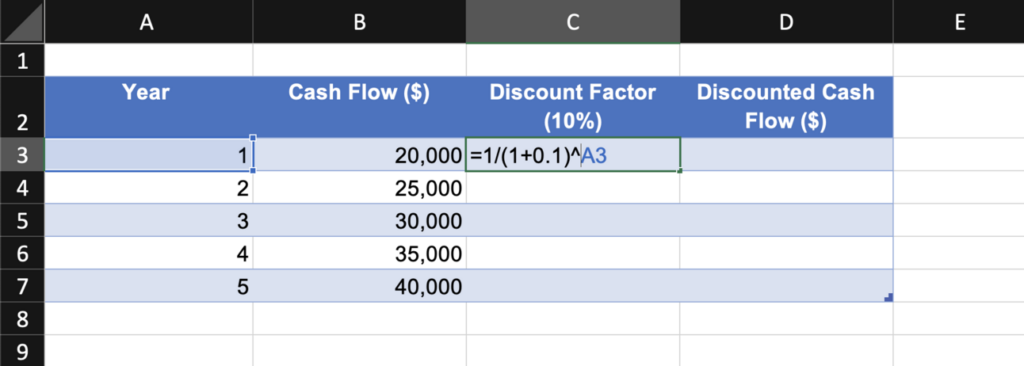
Step 1 – Input the table into Excel.
Step 2 – For Year 1, in the Discount Factor column, type =1/(1+0.10)^A3, where A2 references the year.Manual NPV Calculation – Discount Factor
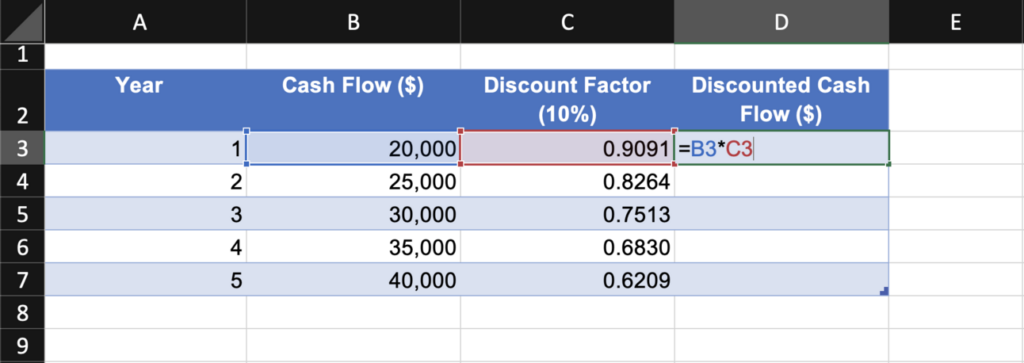
Step 3 – Drag this formula down to fill it for all years.
Step 4 – For Year 1, in the Discounted Cash Flow column, type =B3*C3, where B2 is the cash flow and C2 is the discount factor.
Step 5 – Drag this formula down for all years.
Step 6 – Sum up all the values below the Discounted Cash Flow column to get the NPV.
By following these steps, you’ve learned how to calculate NPV manually in Excel. This hands-on approach solidifies your understanding of NPV and equips you with the skills to handle more complex financial scenarios in the future.
Comparing the Two Methods
In financial analysis, the path to a solution can be as enlightening as the solution itself. By now, you’re familiar with the built-in NPV function in Excel and how to calculate NPV manually in Excel. While each method has its merits, understanding its comparative advantages and limitations can guide you in choosing the most appropriate approach for your specific scenario.
Download your Free NPV Template now.
Built-in NPV Function vs. Manual Calculation: A Comparative Analysis
Navigating the intricacies of Excel, especially when determining NPV, can be a journey of choices. Let’s delve into each method’s strengths and potential drawbacks to paint a clearer picture.
Advantages of Using Excel’s Built-in NPV Function:
- Efficiency: With just a few clicks, you can quickly derive the NPV, which is especially beneficial when time is of the essence.
- Reduced Error Margin: Automation minimizes the risk of manual errors, ensuring more consistent results.
- User-Friendly: Even for those not fully versed in calculating NPV manually in Excel, the built-in function provides an accessible entry point.
Advantages of Manual NPV Calculation:
- In-depth Understanding: Manually calculating NPV offers a granular view of each step, deepening your comprehension of the process.
- Flexibility: This method shines when dealing with non-uniform discount rates or when custom adjustments are needed.
- Transparency: Every calculation step is visible, allowing easy verification and validation.
When to Use Which Method?
Choosing between the built-in function and manual calculation often hinges on the specific requirements of your analysis:
- For Quick Assessments: If you’re looking for a rapid evaluation, especially with uniform discount rates, Excel’s NPV function is your go-to tool.
- For Detailed Analysis: When the goal is to understand the nuances or when dealing with varying discount rates, knowing how to calculate NPV manually in Excel becomes invaluable.
Both methods offer unique advantages, and the choice largely depends on the context of your financial analysis. By mastering the automated and manual approaches, you equip yourself with a versatile skill set, ready to tackle various financial challenges confidently.
In Conclusion
In the dynamic landscape of finance, the ability to discern between efficient automation and hands-on calculation can make all the difference. While Excel’s built-in NPV function streamlines the process, understanding how to calculate NPV manually in Excel offers a deeper insight into the mechanics of financial analysis.
Whether you opt for the convenience of Excel’s tools or delve into the intricacies of manual calculation, the goal remains: to harness Net Present Value’s power for sound financial decision-making. With these skills in your arsenal, you’re well-prepared to navigate the complexities of investment appraisal and project evaluation with confidence and competence. So, explore both avenues and chart your course toward financial excellence.
Frequently Asked Questions (FAQ)
- What is NPV, and why is it important? NPV, or Net Present Value, is a financial metric used to evaluate the profitability of investments or projects. It measures the difference between the present value of cash inflows and outflows over time. NPV is important because it helps assess the value of an investment relative to its costs and potential returns.
- When should I use Excel’s built-in NPV function? Excel’s built-in NPV function is ideal when you need a quick assessment of an investment’s net present value, especially when the discount rate remains constant. It’s efficient, minimizes errors, and is user-friendly.
- When should I calculate NPV manually in Excel? Manual NPV calculation in Excel is valuable when you seek a more in-depth understanding of the NPV process, or when dealing with scenarios involving varying discount rates or custom adjustments. It offers flexibility and transparency in your financial analysis.
- Can I use Excel to calculate both NPV and IRR simultaneously? Yes, you can. Excel offers functions like NPV and IRR that allow you to simultaneously evaluate an investment’s NPV and internal rate of return (IRR). Both metrics provide valuable insights into the viability of an investment or project.
- How do I handle changing discount rates over time in manual NPV calculation? When dealing with changing discount rates, calculate the discount factor for each year separately using the formula: =1/(1+rate)^year. Apply this custom discount factor to each year’s cash flow to calculate the discounted cash flow for that year. Sum these discounted cash flows to obtain the NPV.
- What are some common mistakes to avoid when calculating NPV manually in Excel? Common mistakes include incorrect formulas for discount factors, cash flows, or interactions. Ensure consistency in using discount rates and verify your calculations by cross-referencing them with Excel’s NPV function results.
- Why is it important for financial professionals to understand both methods of NPV calculation? A well-rounded financial professional should be proficient in automated and manual NPV calculations. This knowledge provides versatility in handling various financial scenarios, enhances decision-making, and fosters a deeper understanding of the underlying principles of financial analysis.
- Are there any shortcuts or Excel features to make manual NPV calculations more efficient? Yes, Excel offers features like autofill and array functions that can expedite manual NPV calculations. Utilizing these tools can help streamline the process while maintaining accuracy.
- Where can I find more resources to enhance my financial analysis skills in Excel? Numerous online tutorials, courses, and financial modeling resources are available to sharpen your skills. Consider exploring financial education platforms and Excel-specific training programs to expand your knowledge.
- How can I apply NPV analysis in real-world financial decision-making? NPV analysis is widely used in capital budgeting, investment appraisal, and project evaluation. Financial professionals can use NPV to determine whether an investment is financially viable, compare multiple investment opportunities, and make informed decisions based on future cash flows and discount rates.